先做个广告:如需代注册ChatGPT或充值 GPT5会员(plus),请添加站长微信:gptchongzhi
ChatGPT全自动分析数据
 推荐使用GPT中文版,国内可直接访问:https://ai.gpt86.top
我提出一个问题
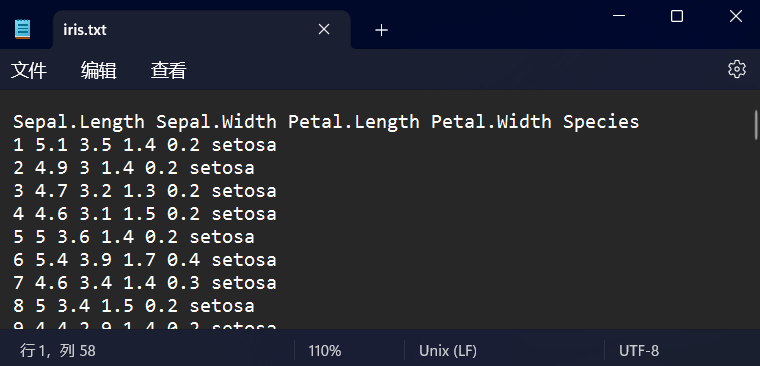
这是一份鸢尾花数据集,请根据这份数据进行统计分析并作图,分析相关性、显著性等指标,绘制热图、散点图、折线图、箱线图,并给出你的看法。(只需要我输入问题和数据txt文件)

ChatGPT 4.0 Plus 的回答
import pandas as pd
# Load the dataset
iris = pd.read_csv("/mnt/data/iris.txt")
# Display the first few rows of the dataset
iris.head()

RESULT
  Sepal.Length Sepal.Width Petal.Length Petal.Width Species
0     1 5.1 3.5 1.4 0.2 setosa
1    2 4.9 3 1.4 0.2 setosa
2   3 4.7 3.2 1.3 0.2 setosa
3    4 4.6 3.1 1.5 0.2 setosa
4     5 5 3.6 1.4 0.2 setosa
看起来这个数据集的格式有些问题,所有的数据都在一行,而且包含了很多空格,需要对数据进行清洗,以便后续分析。
数据清洗
现在让我们来进行数据清洗:
# Clean the dataset
iris = iris["Sepal.Length Sepal.Width Petal.Length Petal.Width Species"].str.split(expand=True)
iris.columns = ["Index", "Sepal.Length", "Sepal.Width", "Petal.Length", "Petal.Width", "Species"]

# Drop the "Index" column as it's not necessary
iris = iris.drop(columns=["Index"])

# Convert the numerical columns to float type
for column in ["Sepal.Length", "Sepal.Width", "Petal.Length", "Petal.Width"]:
    iris[column] = iris[column].astype(float)
iris.head()

RESULT
   Sepal.Length  Sepal.Width  Petal.Length  Petal.Width Species
0           5.1          3.5           1.4          0.2  setosa
1           4.9          3.0           1.4          0.2  setosa
2           4.7          3.2           1.3          0.2  setosa
3           4.6          3.1           1.5          0.2  setosa
4           5.0          3.6           1.4          0.2  setosa
数据清洗已完成!现在,我们的数据集包括以下五个特征:
"Sepal.Length":花萼长度 "Sepal.Width":花萼宽度 "Petal.Length":花瓣长度 "Petal.Width":花瓣宽度 "Species":鸢尾花种类
统计分析
我们可以开始进行统计分析了。首先,我们可以通过描述性统计来查看各特征的均值、标准差、最小值、25%、50%、75% 分位数和最大值。然后,我们将使用相关性分析和显著性测试来探索这些特征之间的关系。最后,我们将通过可视化这些数据来进一步分析。
# Descriptive statistics for the dataset
desc_stats = iris.describe()

# Include the count of each species for completeness
desc_stats = desc_stats.append(iris["Species"].value_counts().rename("count"))

desc_stats
描述性统计结果如下:
- "Sepal.Length":
平均值为5.84,标准差为0.83,中位数为5.8,范围从4.3到7.9。
- "Sepal.Width":
平均值为3.06,标准差为0.44,中位数为3.0,范围从2.0到4.4。
- "Petal.Length":
平均值为3.76,标准差为1.77,中位数为4.35,范围从1.0到6.9。
- "Petal.Width":
平均值为1.20,标准差为0.76,中位数为1.3,范围从0.1到2.5。
三种鸢尾花种类,每种都有50个样本
相关性分析
接下来,我们将进行相关性分析。
# Correlation analysis
correlation = iris.corr()

correlation
RESULT
              Sepal.Length  Sepal.Width  Petal.Length  Petal.Width
Sepal.Length      1.000000    -0.117570      0.871754     0.817941
Sepal.Width      -0.117570     1.000000     -0.428440    -0.366126
Petal.Length      0.871754    -0.428440      1.000000     0.962865
Petal.Width       0.817941    -0.366126      0.962865     1.000000
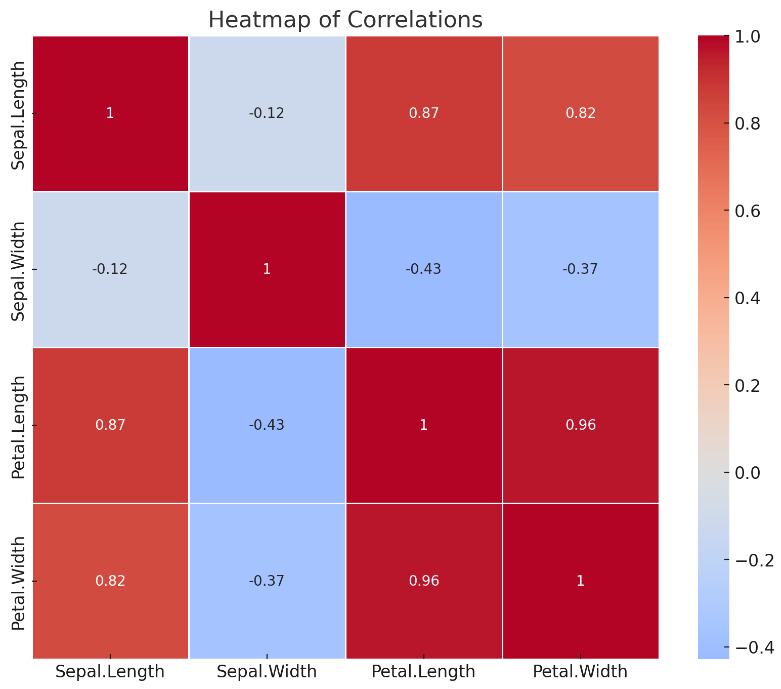
相关性分析结果如下:
- "Sepal.Length" 与 "Petal.Length" 和 "Petal.Width" 呈强正相关,说明花萼长度增加时,花瓣长度和宽度也有可能增加。
- "Sepal.Length" 与 "Sepal.Width" 呈负相关,但相关性较弱,说明花萼长度增加时,花萼宽度不一定会减少。
- "Petal.Length" 与 "Petal.Width" 呈极强的正相关,说明花瓣长度增加时,花瓣宽度也很可能增加。
接下来,我们可以通过绘制这些特征的热图来直观地查看它们之间的相关性。
import seaborn as sns
import matplotlib.pyplot as plt

# Heatmap of correlations
plt.figure(figsize=(10, 8))
sns.heatmap(correlation, annot=True, cmap="coolwarm", center=0, linewidths=0.5)
plt.title("Heatmap of Correlations")
plt.show()

这是特征之间相关性的热图。颜色越深,表示相关性越强。我们可以看到 "Petal.Length" 与 "Petal.Width" 的相关性最强,且呈正相关。而 "Sepal.Width" 与其余特征的相关性都相对较弱。
散点图绘制
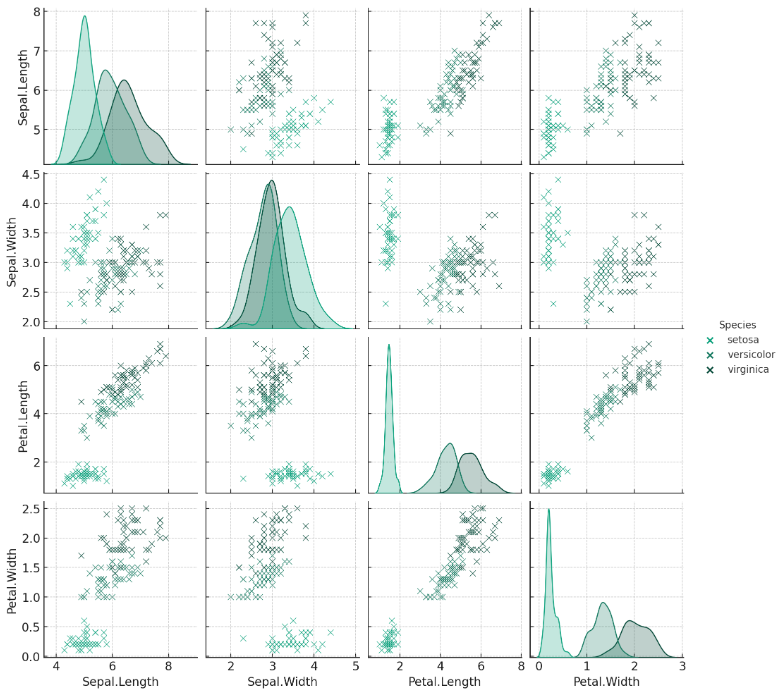
接下来,我们可以通过绘制散点图来查看每对特征之间的关系。在这里,我们会将不同的鸢尾花种类用不同的颜色表示出来,以便观察不同种类鸢尾花在特征之间的关系。
# Pairplot to visualize the relationships between features, colored by species
sns.pairplot(iris, hue="Species")
plt.show()

上图是各特征之间的散点图矩阵,其中不同颜色代表不同种类的鸢尾花。我们可以观察到以下几点:
1. "setosa"(蓝色)与其它两种鸢尾花在花瓣长度和宽度上有明显的区别,这意味着花瓣长度和宽度可以用于区分 "setosa" 与其它种类的鸢尾花。
2. "versicolor"(橙色)和 "virginica"(绿色)在花瓣长度和宽度上的区别不如 "setosa" 明显,但仍有一定的区分度。
3. 花萼长度和宽度对于种类的区分作用不如花瓣长度和宽度明显。
箱线图绘制
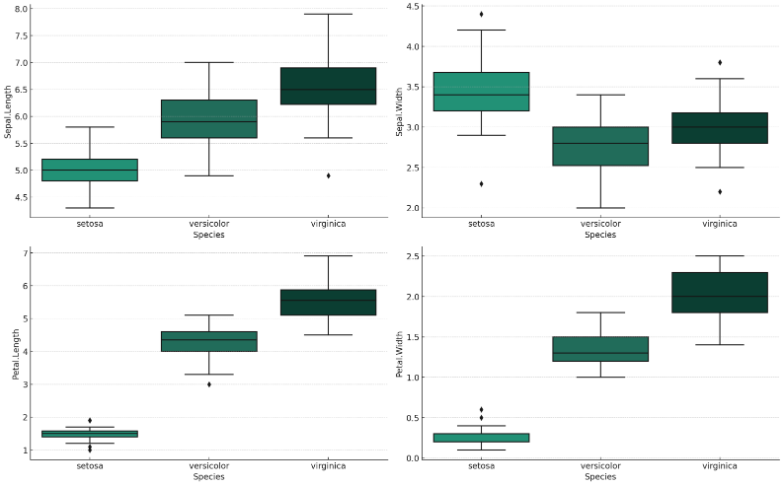
接下来,我们来绘制箱线图,这将有助于我们更好地理解数据的分布以及各个特征的中位数、四分位数和异常值。
# Boxplots for each feature, grouped by species
plt.figure(figsize=(16, 10))

for i, feature in enumerate(["Sepal.Length", "Sepal.Width", "Petal.Length", "Petal.Width"], 1):
    plt.subplot(2, 2, i)
    sns.boxplot(x="Species", y=feature, data=iris)

plt.tight_layout()
plt.show()

上图是每种鸢尾花每个特征的箱线图。箱线图展示了数据的中位数、四分位数和可能的异常值。我们可以从图中观察到以下几点:
# Clean the dataset
iris = iris["Sepal.Length Sepal.Width Petal.Length Petal.Width Species"].str.split(expand=True)
iris.columns = ["Index", "Sepal.Length", "Sepal.Width", "Petal.Length", "Petal.Width", "Species"]

# Drop the "Index" column as it's not necessary
iris = iris.drop(columns=["Index"])

# Convert the numerical columns to float type
for column in ["Sepal.Length", "Sepal.Width", "Petal.Length", "Petal.Width"]:
    iris[column] = iris[column].astype(float)
iris.head()

RESULT
   Sepal.Length  Sepal.Width  Petal.Length  Petal.Width Species
0           5.1          3.5           1.4          0.2  setosa
1           4.9          3.0           1.4          0.2  setosa
2           4.7          3.2           1.3          0.2  setosa
3           4.6          3.1           1.5          0.2  setosa
4           5.0          3.6           1.4          0.2  setosa
0
以上的观察结果与我们之前的相关性分析和散点图矩阵的分析结果相吻合。这说明我们可以通过花瓣的长度和宽度来区分不同种类的鸢尾花,尤其是 "setosa"。
至于显著性分析,通常需要有一个特定的假设或问题,然后通过统计测试来确定观察到的结果是否具有统计显著性。在这个数据集中,我们可能会对比不同种类的鸢尾花在各个特征上是否有显著差异。


网友评论